
Every software team runs tests, but few use QA metrics to measure what those tests actually achieve. These metrics close that gap. They turn testing from an activity into evidence, showing how much of the product is covered, how many defects reach production, how quickly issues are resolved, and whether automation is paying off.
Without them, software quality remains a matter of opinion. With them, teams can pinpoint weak areas, justify QA investment, and release with confidence.
This blog covers the 20 essential QA metrics that matter most, each with its formula, a worked example, and a benchmark for what good looks like. You will also learn how to choose the right metrics, track them on a dashboard, and apply them in agile and AI-driven workflows.
What Are QA Metrics?
QA metrics are quantifiable measures that track the quality, efficiency, and effectiveness of software testing and development. They convert testing activity into objective data like defect counts, coverage percentages, resolution times, that teams use to assess product quality and improve their processes. In short, they answer a single question: is our testing working?
Test metrics are a subset of this. They focus narrowly on the testing phase itself, measuring things like test execution and pass rates, whereas QA metrics span the full quality process from requirements to release. Put simply, all test metrics are QA metrics, but QA metrics also cover process and project health that testing alone does not capture.
Why Are QA Metrics Important?
Testing without measurement is guesswork. QA metrics give teams the evidence to know whether their quality efforts are working and where to focus next. Here is what they make possible:
- Ensure product quality: Metrics verify that the software meets functional and non-functional requirements before it reaches users, rather than relying on assumptions.
- Drive continuous improvement: Tracking the same metrics across sprints reveals trends, exposes weak areas, and shows whether process changes actually moved the needle.
- Enable data-driven decisions: Teams can decide what to test, where to add coverage, and whether a build is ready to ship based on numbers instead of intuition.
- Detect issues early: Rising defect counts or slipping coverage surface problems while they are still cheap to fix, long before they reach production.
- Justify QA investment: Clear data on defect leakage, resolution time, and automation gains helps QA leaders demonstrate ROI and make the case for tools, headcount, or budget.
- Improve customer satisfaction: Fewer escaped defects and more stable releases translate directly into a better user experience and stronger product reputation.
Types of QA Metrics
Apart from grouping metrics by what they measure, it helps to understand the conceptual split between the two kinds of numbers you will track.
Quantitative vs. Qualitative QA Metrics
Quantitative metrics are raw, absolute numbers that measure a single aspect of testing, such as the count of defects found or test cases executed. Qualitative metrics are derived numbers, usually ratios or percentages that relate two or more quantitative metrics to reveal effectiveness, such as defect leakage or test case effectiveness. Quantitative metrics tell you what happened; qualitative metrics tell you what it means.
Product, Process, and Project Metrics
The 20 metrics in this guide are organized into three practical categories:
- Product quality metrics measure the quality of the software itself, including defect density, test coverage, and escaped defects.
- Process quality metrics measure how well the QA and development processes are running, including automation coverage, defect resolution time, and MTTR.
- Project quality metrics measure progress, cost, and timelines, including test execution progress, cost of quality, and time to market.
Top 20 Essential QA Metrics for 2026
The 20 metrics below are grouped into product, process, and project categories. Each includes a plain definition, its formula, and a worked example so you can apply it immediately.
| No. | Metric | Category | What It Tells You |
| 1 | Defect Density | Product | Which areas of the code carry the most quality risk |
| 2 | Defect Leakage | Product | How well each testing stage catches issues before the next |
| 3 | Defect Removal Efficiency (DRE) | Product | What share of defects you catch before release |
| 4 | Test Coverage | Product | How much of the product your tests actually exercise |
| 5 | Requirements Coverage | Product | Whether every requirement has a test behind it |
| 6 | Escaped Defects | Product | How many defects your users find for you |
| 7 | Defect Severity Index | Product | How damaging your open defects are, not just how many |
| 8 | Test Case Effectiveness | Process | Whether your test cases are actually finding bugs |
| 9 | Test Automation Coverage | Process | How much of your testing is automated and repeatable |
| 10 | Test Execution Rate | Process | Whether testing speed keeps up with release velocity |
| 11 | Defect Resolution Time | Process | How fast defects get fixed and verified |
| 12 | Defect Reopen Rate | Process | Whether your fixes actually hold |
| 13 | Mean Time to Detect (MTTD) | Process | How quickly you spot defects after they appear |
| 14 | Mean Time to Recovery (MTTR) | Process | How fast you recover from production failures |
| 15 | Build Failure Rate | Process | How stable your builds and integrations are |
| 16 | Test Flakiness Rate | Process | Whether your automated tests can be trusted |
| 17 | Test Execution Progress | Project | Whether testing is on track to finish on schedule |
| 18 | Test Environment Availability | Project | How much testing time you lose to downtime |
| 19 | Cost of Quality / Cost per Bug Fix | Project | What quality is costing you |
| 20 | Time to Market | Project | How quickly you get from start to release |
Product Quality Metrics
These measure the quality of the software itself: how many defects it holds, how thoroughly it has been tested, and how many issues reach users.
1. Defect Density
Defect density tells you where quality risk is concentrated. It counts confirmed defects against the size of a module, usually per 1,000 lines of code (KLOC), so you can see which areas are carrying the most problems. A module of 5,000 lines with 15 defects works out to 3 defects per 1,000 lines.
Defect Density = (Total defects / Size in KLOC) × 1,0002. Defect Leakage
This metric asks how many bugs each testing stage is letting through to the next. It is the defects caught in a later stage, such as UAT, divided by the total found before that stage. So 8 defects surfacing in UAT after 200 were caught earlier gives a leakage rate of 4%. Defects that make it all the way to production are tracked separately, as escaped defects (metric 6).
Defect Leakage = (Defects found in UAT / Total defects found before UAT) × 100
3. Defect Removal Efficiency (DRE)
DRE is one of the clearest signals of whether your process catches problems early. It is the share of defects found before release out of every defect found before and after. If you catch 90 defects pre-release and 10 slip out, your DRE is 90%.
DRE = (Defects before release / (Defects before + defects after)) × 100
4. Test Coverage
Coverage measures how much of the application your tests actually exercise, by code, feature, or functionality. Tested against 250 requirements, covering 225 of them puts you at 90%. This is not the same as test execution progress, which tracks how many planned tests you have run, not how much of the product they touch.
Test Coverage = (Items covered / Total items) × 100
5. Requirements Coverage
Requirements coverage checks that every documented requirement has at least one test behind it. With 180 of 200 requirements covered, you are at 90%. It matters most in regulated domains, where traceability from specification to validation is not optional.
Requirements Coverage = (Requirements tested / Total requirements) × 100
6. Escaped Defects
These are the defects that reach production and get discovered after release, often by your users. Few metrics matter more, because this one counts real, user-facing failures that testing missed. Five production defects out of 50 total is a 10% escape rate.
Escaped Defects = (Escaped defects / Total defects) × 100
7. Defect Severity Index
A raw defect count treats a typo and a checkout-breaking crash as equal. The severity index corrects for that by weighting each defect by its severity. Three critical defects at level 5, six high at level 4, and eleven low at level 2 give an index of 3.05, which places the average open defect in the medium-to-high range.
Defect Severity Index = Σ(severity level × defects at that level) / Total defects
Process Quality Metrics
These metrics measure how well the QA and development processes are running: how efficient the testing is, how fast defects are resolved, and how stable the pipeline remains.
8. Test Case Effectiveness
This shows whether your test cases are pulling their weight, measured as defects found per test case executed. Find 25 defects across 100 cases and effectiveness is 25%. Watch the trend rather than the single figure: a suite that keeps growing while effectiveness stays flat is adding tests that find nothing.
Test Case Effectiveness = (Defects found / Test cases executed) × 100
9. Test Automation Coverage
Automation coverage is the percentage of your total test cases that run automatically rather than by hand. With 200 of 500 automated, you are at 40%. Raising that figure without drowning in maintenance is increasingly where AI test automation tools do the heavy lifting.
Test Automation Coverage = (Automated cases / Total cases) × 100
Stop racing your own backlog. BotGauge owns testing end to end, up to 80% coverage in two weeks
See it on your codebase10. Test Execution Rate
Execution rate is a throughput measure: how many test cases you get through in a given period. Run 600 over five working days and your rate is 120 a day. It answers whether testing can keep pace with how often you release, which is different from execution progress (metric 17), a measure of completeness rather than speed.
Test Execution Rate = Test cases executed / Time period
11. Defect Resolution Time
This captures how long a defect takes to go from reported to fixed and verified, on average. Ten defects resolved in a combined 30 hours averages 3 hours each. Read alongside team capacity, it shows whether fixes are keeping up or quietly piling into a backlog.
Defect Resolution Time = Total resolution time / Defects resolved
12. Defect Reopen Rate
A fix that does not hold costs the work twice. Reopen rate measures how often supposedly-fixed defects come back. Ten reopened out of 100 resolved is a 10% reopen rate. A climbing number usually points to rushed fixes or weak verification.
Defect Reopen Rate = (Reopened defects / Total resolved defects) × 100
13. Mean Time to Detect (MTTD)
MTTD is the average gap between a defect being introduced and being noticed. Twelve defects taking a combined 96 hours to surface averages 8 hours. The shorter it is, the cheaper your defects are to fix, since cost rises the longer a bug sits undetected.
MTTD = Sum of detection times / Total number of defects
14. Mean Time to Recovery (MTTR)
MTTR measures how fast you restore service after a production failure, not how fast you fix a defect found in testing. With 180 minutes of downtime across 6 incidents, MTTR is 30 minutes each. It is one of the four DORA metrics, and you will sometimes see it written as mean time to repair.
MTTR = Total incident downtime / Number of incidents
15. Build Failure Rate
Build failure rate is the share of builds that fail during integration or testing. Six failures in 120 builds is 5%. When this stays high, the cause is usually unstable integration, flaky tests, or a misconfigured environment.
Build Failure Rate = (Failed builds / Total builds) × 100
16. Test Flakiness Rate
Flakiness is the percentage of test runs that give different results on identical code, passing once and failing the next time for no real reason. Thirty flaky failures across 2,000 runs is 1.5%. The real damage is to trust: once a suite is flaky enough, developers start ignoring red builds. Bringing it down often comes down to self-healing test automation, which updates tests as the UI changes instead of letting them break.
Test Flakiness Rate = (Non-deterministic failures / Total executions) × 100
Pay for coverage delivered, not seats. BotGauge frees your QA team from manual upkeep
Start a 30-day pilotProject Quality Metrics
These metrics measure the health of the testing project itself: how far testing has progressed, how reliable the environment is, what quality costs, and how quickly the product reaches users.
17. Test Execution Progress
Progress is a snapshot of how much planned testing is done, useful for daily and weekly reporting. Execute 400 of 500 planned and you are 80% through. Unlike execution rate (metric 10), which measures speed, this tells you whether you will finish on schedule.
Test Execution Progress = (Test cases executed / Test cases planned) × 100
18. Test Environment Availability
You cannot test against an environment that is down. Availability tracks the share of planned testing time the environment was actually stable and accessible. Forty-five usable hours out of 50 scheduled is 90%. In cloud-native and distributed setups, lost environment time turns directly into delayed releases.
Test Environment Availability = (Available time / Planned testing time) × 100
19. Cost of Quality (and Cost per Bug Fix)
Cost of quality (CoQ) is the full price of achieving and maintaining quality: prevention, detection, and the cost of internal and external failures. Sitting underneath it is the more granular cost per bug fix. Spend 15,000 USD fixing 50 defects and each one cost 300 USD. Together they let leaders weigh quality spend against what poor quality actually costs.
Cost of Quality = Prevention + Detection + Internal failure + External failure costs
Cost per Bug Fix = Total cost of fixing defects / Number of defects fixed
20. Time to Market
Time to market is the elapsed time from a project starting to it shipping. A project beginning on 1 March and shipping on 12 June took roughly 103 days. It is not a testing metric in the narrow sense, though it belongs here: slow or unreliable QA is one of the most common reasons launches slip.
Time to Market = Release date − Project start date
QA Metrics Benchmarks and Targets
A metric is only useful if you know what number to aim for. The targets below are drawn from industry research and widely used conventions, and they serve as starting reference points rather than universal laws. What counts as “good” varies with your domain, team maturity, and risk tolerance: a fintech or healthcare product rightly aims far stricter than an early-stage consumer app. Treat these as guides to calibrate against, not pass/fail gates.
| Metric | Strong | Acceptable | Needs Attention |
| Defect Density | < 1 per KLOC | 1–3 per KLOC | > 3 per KLOC |
| Defect Removal Efficiency | > 95% | 90–95% | < 90% |
| Escaped Defects (production) | < 5% | 5–10% | > 10% |
| Defect Leakage (to UAT) | < 5% | 5–10% | > 10% |
| Test Coverage (critical paths) | > 90% | 75–90% | < 75% |
| Test Automation Coverage | > 70% regression | 40–70% | < 40% |
| Defect Reopen Rate | < 5% | 5–10% | > 10% |
| Test Flakiness Rate | < 2% | 2–5% | > 5% |
| Build Failure Rate | < 5% | 5–10% | > 10% |
| Regression Suite Runtime | < 30 min | 30–60 min | > 60 min |
| Critical Defect Resolution | < 48 hours | 2–5 days | > 5 days |
| Test Environment Availability | > 95% | 90–95% | < 90% |
A few of these deserve context. For escaped defects, below 5% is considered good across most software industries, while high-performing teams target below 2%, but the realistic baseline is sobering: teams without deliberate QA investment commonly sit in the 30–50% range. For test coverage, chasing 100% is usually a poor investment; most teams target 70–80% as a practical goal, since full coverage is expensive to maintain and often not worth it, with the higher >90% bar reserved for critical paths like payments and authentication.
The most important rule with benchmarks is to weight the trend over the absolute number. An escaped-defect rate of 8% is hard to judge in isolation, but a rate that has fallen from 15% to 8% over three months is a clear improvement story. Track movement over time, segment by severity (a 5% escape rate of critical defects is worse than a 20% rate of trivial ones), and never rank teams against each other on a single metric, which only encourages gaming.
A note on DORA metrics
For teams working in CI/CD and DevOps, the DORA metrics (from Google’s annual State of DevOps research) are the most rigorously validated delivery benchmarks available, and they are the ones most often requested by engineering leadership. QA practices directly influence all of them. The four keys, with elite-performer benchmarks:
| DORA Metric | What It Measures | Elite Benchmark |
| Deployment Frequency | How often code reaches production | On-demand / multiple per day |
| Lead Time for Changes | Commit to running in production | Less than one day |
| Change Failure Rate | Deployments causing a failure | Around 5% |
| Failed Deployment Recovery Time | Time to restore service after a failed deployment | Less than one hour |
Two things worth knowing so you use these accurately. The fourth metric was formerly called Mean Time to Recovery and has been renamed Failed Deployment Recovery Time, narrowing it specifically to recovery from failed deployments rather than all outages.
QA Metrics in Agile
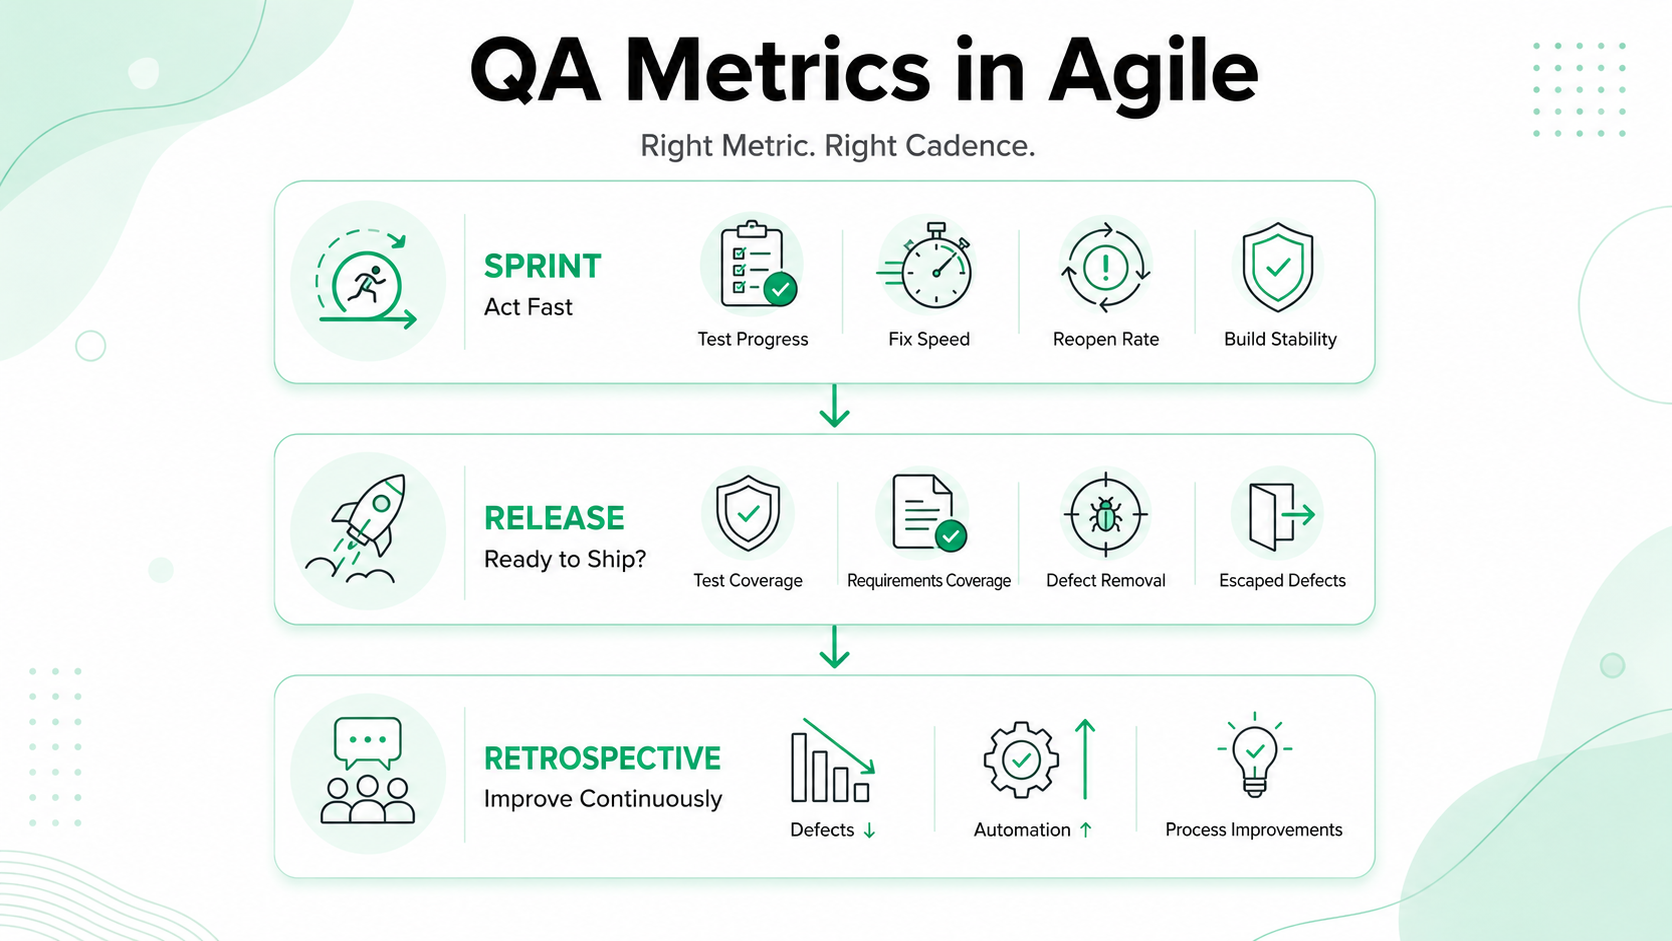
In agile teams, metrics work best when matched to the cadence they inform.
Within a sprint, track a small set that surfaces problems while there is still time to act: test execution progress (will testing finish on time), defect resolution time and reopen rate (are fixes keeping pace and holding), and build failure and flakiness rates (is the pipeline stable). These are the numbers worth a glance in daily standups.
At the release level, shift to readiness metrics: test coverage, requirements coverage, defect removal efficiency, and escaped defects from prior releases. These answer whether the build is safe to ship.
In retrospectives, trends matter more than snapshots. Bring metrics that show movement across sprints, such as escaped defects trending down or automation coverage climbing, and use them to drive process changes rather than to assign blame.
Predictive and AI-Driven QA Metrics
Most QA metrics are backward-looking: they report what already happened. Predictive metrics use historical data and trends to forecast what is likely to happen next, shifting QA from reactive to proactive.
In practice, this means reading patterns rather than snapshots. A module with consistently high defect density and frequent code changes can be flagged as risky before its next release, so testing concentrates where failure is most likely. A defect leakage rate trending upward across sprints signals that escaped defects will rise unless coverage improves. This is why QA teams use predictive metrics: to direct limited testing effort toward the highest-risk areas before defects reach production, instead of discovering problems after the fact.
The urgency behind this is AI-generated code. As teams adopt AI coding assistants, the volume of code shipped has climbed sharply, and testing demand has risen with it. Manual test creation cannot keep pace, which widens coverage gaps exactly when risk is growing. Closing that gap requires generating and maintaining tests as fast as code ships, and producing the consistent trend data predictive metrics depend on, which is where an agentic AI testing platform earns its place.
How to Choose the Right QA Metrics
Tracking every possible metric is a mistake. The goal is a small, relevant set that drives decisions. Five principles for choosing well:
Align metrics to your goals
Start from what you are trying to achieve, whether that is fewer production defects, faster releases, or scaling automation, and pick the metrics that answer that specific question. Every metric on your list should map to a decision someone will actually make.
Avoid vanity metrics
Numbers that look impressive but change no decisions are noise. The total count of test cases written is a classic example: it signals activity, not effectiveness. Favor metrics like test case effectiveness and escaped defects that measure outcomes.
Match your team’s maturity and stage
Early-stage teams benefit most from coverage and defect density. Teams with mature CI/CD pipelines should lean on build failure rate, automation coverage, and flakiness. Post-release, escaped defects and resolution time matter most.
Baseline before you improve
Measure each metric over a full sprint or release cycle before setting targets. Without a starting point, you cannot tell whether a change actually helped.
Automate data collection
Manual tracking is inconsistent and quickly abandoned. Pull data directly from your test management, CI, and defect-tracking tools so metrics stay accurate and current with no added effort.
How to Build a QA Metrics Dashboard
A good QA metrics dashboard answers three questions at a glance: how much are we testing, how effective is it, and how good is what we are shipping? The hard part is never the display, it is pulling the data together.
| What Works | |
| What to show | A handful of high-signal metrics, not everything: coverage, escaped defects, resolution time, automation coverage, execution progress. Always with trend lines, not snapshots. |
| The data problem | Metrics sit scattered across Jira, CI/CD testing tools, and test management systems.A real dashboard pulls them into one source of truth automatically, instead of by hand. |
| Real-time vs. snapshot | Live views catch regressions as they happen; snapshots suit standups and sprint reports. Most teams need both. |
Know what's safe to ship, on every release. BotGauge protects the outcomes that matter, not just the metrics
Book a demoChallenges in Implementing QA Metrics
Even a well-chosen set of metrics can fail in practice. The common obstacles:
- Inconsistent or manual data collection. When numbers are gathered by hand, they drift, gaps appear, and teams stop trusting the data. Automated collection is the fix.
- Metrics treated as surveillance. If people see metrics as a way to monitor individuals, they disengage or game them. Frame metrics as tools for improving the process, not for grading people.
- No baselines. Without a reference point, a metric is just a number. Teams that skip baselining cannot tell real improvement from normal variation.
- Misinterpretation. A single data point read in isolation, or a metric divorced from context, leads to wrong conclusions. Always read metrics as trends, segmented by severity and area.
How BotGauge Helps You Track and Improve QA Metrics
Knowing which metrics to track is one thing. Actually moving them is where most teams stall, because test creation, maintenance, and reporting consume the hours that analysis needs. BotGauge closes that gap with an Autonomous QA as a Solution model: AI agents own the full testing lifecycle, from generating tests to running and maintaining them, while dedicated domain FDE pods (Forward Deployed Engineers) bring the product and industry context automation cannot infer. You pay for the coverage and outcomes delivered, not for seats. Here is how that maps to the metrics in this guide:
| The Challenge | How BotGauge Helps | Metric It Moves |
| AI-generated code outpaces manual test writing | Generates UI, API, and integration tests from Figma designs, and user flows | Automation Coverage increases |
| Test suites grow flaky and costly to maintain | Self-healing tests adapt to UI changes on their own, cutting maintenance and noise | Test Flakiness Rate reduces |
| Defects keep slipping into production | Broader, faster generation plus FDE-pod review closes coverage gaps before release | Escaped Defects reduces |
| Metrics sit siloed across Jira, CI, and test tools | Centralized execution and a single data layer with full traceability | Every metric, on one dashboard |
The result is outcome ownership rather than tool rental: instead of buying software your team still has to operate, you hand off the testing lifecycle and get up to 80% coverage in about two weeks, with the outcomes that matter protected on every release.
You own the product. Let BotGauge own the testing, agents plus engineers, outcomes guaranteed on every release.
Conclusion
Every team values quality. Metrics are what make it measurable.
The 20 metrics in this guide turn quality from a subjective judgment into objective evidence. But the metrics are not the goal. A dashboard of healthy numbers means little if it never changes a decision. What matters is not which metrics you track, but how you respond when one signals a problem, while a defect is still cheap to fix and a trend is still easy to reverse.
Begin with a focused set, establish baselines, and prioritize trends over snapshots. This is the principle behind outcome-based testing: measuring QA by the results it protects, not the activity it logs. The measure of a strong QA process is not how much you test, but how few defects reach your users.
Frequently Asked Questions
Why do QA teams use predictive metrics?
What are the top QA metrics to track?
What are essential QA metrics?
What is test metrics in QA?
What is the KPI for QA?