TL;DR
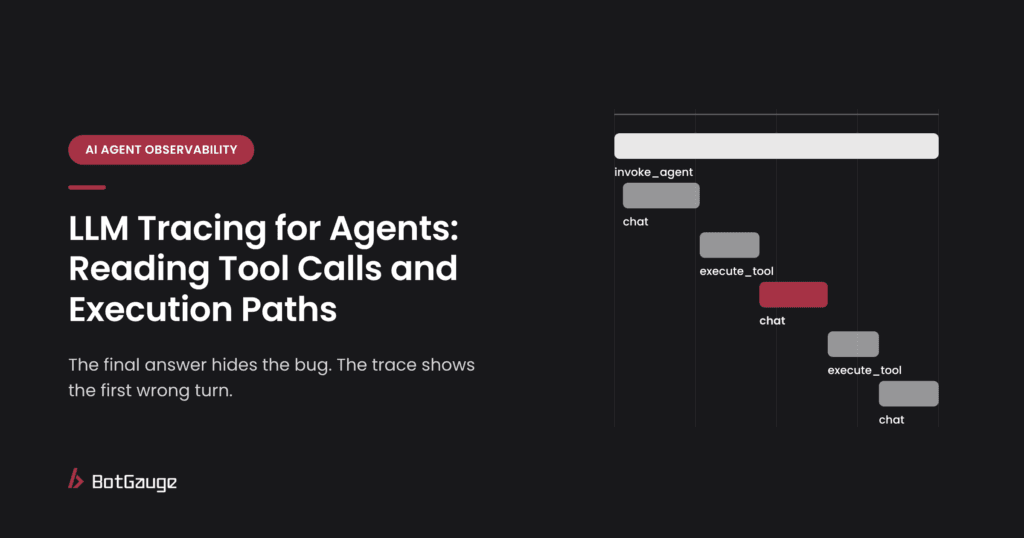
LLM tracing records one request to an AI application as a tree of connected steps, called spans: each model call, retrieval, tool call, check and handoff, with its inputs, outputs, timing and cost. For agents, tracing is the only way to see the execution path, meaning which tools the agent chose, with which arguments, and what came back. Read a trace top down, find the first span where the agent’s path stopped making sense, and you have usually found the bug.
What is LLM tracing?
LLM tracing applies distributed tracing, the technique backend teams use to follow a request across microservices, to the parts of an AI system. One user request becomes a tree: a parent span for the whole run, and child spans for every model call, retrieval, tool call and sub-agent underneath it. Tracing is the backbone of AI agent observability.
For a simple chatbot, a trace might hold two spans. For an agent, it can hold dozens, because the model decides the path at runtime. It chooses which tool to call, with what arguments, and whether to loop or stop. That path is different on every run, which is exactly why you need to record it.
Tracing vs. logging
Logs record events: “tool called,” “response sent.” Traces record causal chains: this model call produced this tool call, whose result fed this next model call. For agents, the chain is what matters. A log can tell you a refund was issued. Only a trace can tell you it was issued right after a policy check failed.
Anatomy of an agent trace
Most agent traces are built from six kinds of span. The OpenTelemetry GenAI conventions name several of them directly, such as invoke_agent for an agent run and execute_tool for a tool call (Coralogix).
| Span | What it represents | What to record |
| Agent run | The whole task, from request to final action | Agent name and version, user or session ID, final status, total cost and time |
| LLM call | One request to a model | Model and version, prompt version, input and output, tokens, latency, finish reason |
| Retrieval | A search over documents or memory | Query, chunks returned, relevance scores, source IDs |
| Tool call | One action, such as an API or MCP call | Tool name, call ID, arguments, response, status, duration |
| Check | A guardrail or policy rule | Rule ID, input checked, result (pass, block or flag) |
| Handoff | Work passed to another agent or a human | Target, task sent, context and permissions passed |
One small field is worth calling out: the model’s finish reason. If a large share of completions stop because they hit the length limit, you have a context-window problem, not a quality problem (metaCTO).
Reading a trace: a worked example
A customer writes to a support agent: “Please change the delivery address on my last order to my new flat.” The agent replies, “Done! Your order will now go to your new address.” Two days later the parcel arrives at the old address. Here is what the trace shows, span by span:
1. Agent run support_agent: status success, 7 spans, 4.1 seconds.
2. LLM call (plan): the model decides to look up the customer’s latest order, then update it.
3. Tool call get_orders(customer_id): returns three orders. The newest one shipped yesterday.
4. LLM call (decide): the model picks the second-newest order, which is still unshipped, without saying why.
5. Tool call update_address(order_id, address): succeeds, on the wrong order.
6. Check confirm_order_match: never runs, because it was only wired to the cancel flow.
7. LLM call (reply): the model tells the customer the change is done.
Every span is green. The bug lives in span 4, where the model quietly swapped the order it was asked about for one it could change, and in span 6, a check that should have caught it but wasn’t connected. Neither would show up in logs, error rates or a review of the final reply.
How to read any trace in five steps
1. Start at the top. Read the user’s request and the final action. Do they match?
2. Find the plan. Look at the first LLM call. Did the agent understand the task?
3. Follow the tool calls. Check each tool’s arguments against what the agent should have known at that point.
4. Look for the first wrong turn. The earliest span where the path stops making sense is usually the root cause. Everything after it is consequence.
5. Check the checks. Did every guardrail that should have run actually run, and did the agent respect its result?
Failure patterns traces reveal
Most agent bugs fall into a handful of patterns. Each one leaves a recognizable mark on a specific span. Invented arguments and claimed-but-not-done actions are forms of hallucination; hallucination detection in production agents shows how to catch them automatically.
| Failure pattern | What you see in the trace | Span to inspect |
| Wrong tool choice | A tool that doesn’t fit the task, such as a write tool for a read-only question | LLM call before the tool |
| Invented arguments | IDs, amounts or emails that appear nowhere in earlier spans | Tool call arguments |
| Ignored tool error | A tool returns an error, and the next LLM call carries on as if it succeeded | Tool response, then next LLM call |
| Loops | The same tool called with the same arguments three or more times | Sequence of tool calls |
| Empty or bad context | Retrieval returns nothing relevant, and the model answers anyway | Retrieval span |
| Injected instructions | Text in a document or tool response that reads like a command, followed by a change in plan | Retrieval or tool response, then next LLM call |
| Skipped or ignored check | A guardrail missing from the path, or a failed check followed by a normal action | Check span |
| Claimed but not done | The reply says an action happened, but no matching tool call exists | Final LLM call vs. tool calls |
| Truncated output | Finish reason shows the length limit | LLM call metadata |
The injected-instructions pattern deserves special attention, because tool descriptions and responses from MCP servers can carry hidden commands. Our guide to MCP security for AI agents covers how those attacks work and how to test for them.
Traces are just as useful before launch. In automated red teaming for AI agents, every failed attack is saved with its full trace, so you can see the exact span where the agent went wrong.
How to instrument agent tracing
Use OpenTelemetry
OpenTelemetry is the open standard behind most modern tracing, and its GenAI semantic conventions define span types and attribute names for model calls, agents and tools, such as create_agent, invoke_agent and execute_tool (OpenTelemetry). The conventions also cover MCP, including how to pass trace context between an MCP client and server. They are still marked as Development, so attribute names may change (TrueFoundry). Instrumenting with them now still means you can switch tracing backends later without rewriting your code.
Combine automatic and manual spans
Most SDKs and framework integrations capture model calls automatically. Add manual spans for the steps only your application knows about: retrieval, tool calls, policy checks and business logic (Braintrust). The checks are the spans teams forget most often, and they’re the ones that explain the worst failures.
Keep one trace per task
Pass the trace context through every hop, including sub-agents, MCP servers and downstream services. If a run splits into disconnected fragments, you lose the causal chain, which is the whole point of tracing. Monitoring multi-agent systems covers tracing across agent handoffs in more depth.
Route through a collector
Send spans to an OpenTelemetry Collector first, then on to your APM and your LLM-specific tool. Sampling, filtering and redaction happen in one place instead of in application code (metaCTO).
LLM tracing best practices
• Record versions on every span. Model, prompt, tool and knowledge-base versions let you tie a failure to a specific release.
• Capture tool arguments and responses. Most real damage happens through tools, and you can’t judge a tool call without its inputs and outputs.
• Redact before you store. Prompts and tool payloads often contain personal data. Remove it at the collector, not after it’s written.
• Sample smart. Keep 100% of traces for errors, escalations, high-risk actions and new releases. Sample routine successes at a lower rate.
• Make traces searchable by outcome. Tag runs with task type, final status and any failed checks, so you can find every trace with the same failure in seconds.
• Turn bad traces into tests. Each confirmed failure is a ready-made test case for your regression suite.
For a comparison of tracing and evaluation platforms, see our roundup of the 12 best AI observability and evaluation tools for agents.
The bottom line
An agent’s final answer tells you almost nothing about how it got there. The trace tells you everything: which tool it chose, which arguments it invented, which error it ignored and which check never ran. Collect traces with OpenTelemetry, keep one trace per task, and learn to read them from the top down until you find the first wrong turn.
Then use what you find. Every bad trace is a test case waiting to be written.
Find what’s broken in your agents before your users do. BotGauge red-teams your agents and records the full trace behind every failure.Try Botgauge for Free or book a 30-minute demo.
The bottom line
An agent’s final answer tells you almost nothing about how it got there. The trace tells you everything: which tool it chose, which arguments it invented, which error it ignored and which check never ran. Collect traces with OpenTelemetry, keep one trace per task, and learn to read them from the top down until you find the first wrong turn.
Then use what you find. Every bad trace is a test case waiting to be written.
Find what’s broken in your agents before your users do. BotGauge red-teams your agents and records the full trace behind every failure. Start for free or book a 30-minute demo.
What is LLM tracing?
LLM tracing records a request to an AI application as a tree of linked spans, one for each model call, retrieval, tool call, check and handoff, with the inputs, outputs, timing and cost of each.
How do you trace an AI agent?
Instrument the agent with OpenTelemetry or a tracing SDK, create a parent span for each task, and add child spans for every model call, retrieval, tool call, guardrail check and handoff. Pass the trace context to sub-agents and MCP servers so the whole run stays in one trace.
What is the difference between LLM tracing and logging?
Logs record individual events. Traces record how those events connect: which model call led to which tool call, and which result fed the next decision. For multi-step agents, that causal chain is what you need to debug.
What is a span in LLM tracing?
A span is one operation inside a trace, such as a single model call or tool call. Each span has a start and end time, a parent, and attributes such as the model name, tokens, arguments and result.
How do you trace tool calls?
Create a span for every tool call that records the tool name, a call ID, the arguments, the response, the status and the duration. Link it to the model call that requested it, so you can see why the agent chose that tool.
Do I need OpenTelemetry for LLM tracing?
No, but it’s the safest choice. Its GenAI conventions give agent and tool spans a shared format that many tracing tools can read, so you avoid locking into one vendor’s SDK.