TL;DR
Agent observability is the practice of capturing every step an AI agent takes in production, including its prompts, reasoning, tool calls, retrieved context and final outputs, so you can see why it behaved the way it did. Monitoring tells you that something went wrong; observability tells you why. It rests on four signals (traces, metrics, logs and evaluations) and increasingly uses the OpenTelemetry GenAI conventions as a shared format. On its own, it shows what happened to real users. Paired with evals and red teaming, it also shows what could go wrong next.
What is agent observability?
An AI agent is given a goal, such as “resolve this refund request,” and then works toward it on its own. It plans, calls tools, reads documents, hands work to other agents and takes actions with real consequences. Agent observability is the ability to reconstruct that whole journey after the fact: what the agent was asked, what it saw, what it decided at each step, which tools it called with which arguments, and what came back.
The difference from a chatbot matters. When a chatbot gives a bad answer, you read the prompt and the reply. When a ten-step agent run issues a refund it shouldn’t have, the reply may look perfectly polite. The mistake happened three steps earlier, when the agent retrieved the wrong policy or misread a tool result. A dashboard showing “error rate: 2%” can’t show you that. A trace can.
Most teams describe agent observability through four signals:
• Traces: the full execution path of one run, broken into spans for each model call, retrieval, tool call and handoff.
• Metrics: aggregated numbers over many runs, such as latency, cost per task, tool error rate and task success rate.
• Logs: step-level events and payloads, such as the exact prompt, the retrieved chunks and the raw tool response.
• Evaluations: scores that judge whether an output was correct, grounded, safe and on-policy.
The first three come from traditional software observability. Evaluations are the AI-specific addition, because an agent can return HTTP 200, finish in two seconds and still be wrong.
Agent observability vs. LLM monitoring vs. APM
| Traditional APM | LLM monitoring | Agent observability | |
| Question it answers | Is the service up and fast? | Is the model call healthy and affordable? | Why did the agent take this path, and was it right? |
| Unit of analysis | Request | Single model call | Whole multi-step run (trace) |
| Typical signals | Uptime, latency, error codes | Tokens, latency, cost, refusal and hallucination rates | Plans, tool calls and arguments, retrieved context, handoffs, eval scores |
| Blind spot | Can’t judge output quality | Can’t see what happened between calls | Needs instrumentation across every tool and agent |
LLM monitoring is a subset of agent observability, not a replacement for it. It covers the model layer; agent observability adds everything that happens between and around model calls. For the model-layer view, see LLM monitoring. For short definitions of the related terms, see what is LLM observability and AI observability in plain English.
The emerging standard: OpenTelemetry GenAI conventions
Teams no longer have to invent their own trace format. OpenTelemetry, the open standard behind most modern tracing, defines GenAI semantic conventions with dedicated span types for agent work, such as create_agent, invoke_agent and execute_tool (OpenTelemetry). In June 2026, the project moved these conventions into their own repository so they can evolve independently, and they are still marked as Development rather than stable (TrueFoundry). The practical advice: instrument with OpenTelemetry now so you can switch backends later, but expect attribute names to keep changing.
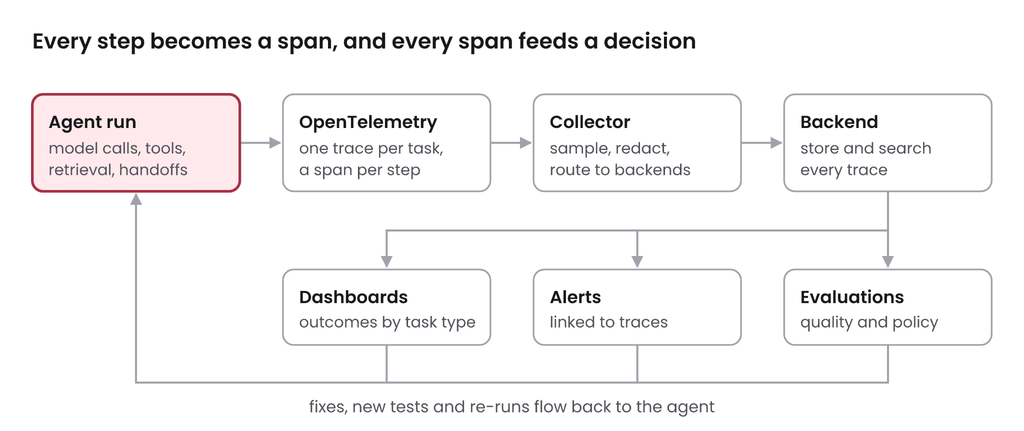
agent observability pipeline · from agent run to decisions
Every model call, retrieval, tool call and handoff becomes a span. A collector samples and redacts them, a backend stores them, and the results drive dashboards, alerts and evaluations, which in turn feed fixes and new tests back to the agent.
Why AI agents need observability
Agents fail in ways traditional software doesn’t, and most of those failures are silent. Gartner expects more than 40% of agentic AI projects to be cancelled by the end of 2027, citing rising costs, unclear business value and weak risk controls (Reuters via The Star; RCR Wireless). Two of those three causes, cost and risk, are exactly what observability is built to expose.
Here is what makes agents different:
- They are non-deterministic. The same input can take a different path on Tuesday than it did on Monday. You can’t reproduce a bug by rerunning the request; you need the trace of the run that failed.
- Errors compound across steps. If each step in a ten-step run is right 95% of the time, the whole run is right only about 60% of the time (0.95^10 ≈ 0.60). Small, invisible mistakes early on become big, visible ones at the end.
- The failure is often upstream of the answer. A wrong refund usually starts with a bad retrieval, a misread tool result or a skipped policy check, not with the final message.
- Success codes lie. An agent can return HTTP 200, stay under its latency budget and confidently do the wrong thing. Only evaluations of the output and the path catch that.
- Costs can run away quietly. A retry loop or an agent that keeps calling the same tool can burn thousands of tokens per task before anyone notices.
- Inputs can be hostile. Emails, documents, web pages and tool outputs can carry hidden instructions. When an agent goes off-script because of one, the trace is the only record of where the instruction came in.
A failure you can only see in the trace
Take a refund agent for an online store. A customer asks for a refund on an order from seven weeks ago, and the policy allows 30 days. The agent classifies the request, retrieves three policy chunks, calls the model, and approves the refund with a friendly message.
The final reply looks fine. The customer is happy. Only the trace shows that the policy check failed at step four, because the customer rephrased the request in a way the policy rule didn’t match, and the agent approved it anyway. In BotGauge red-team runs, this pattern, a policy bypass through paraphrasing, is one of the most common high-severity findings in refund and support agents. Without step-level traces, it looks like a satisfied customer, not a leak.
What to monitor in production
Start with outcomes, then work down to the steps that produce them. A team that tracks only latency and token cost will know its agent is fast and cheap, but not whether it is right. The table below covers the signals that matter for most production agents.
| Layer | What to track | Why it matters | Example alert |
| Outcome | Task success rate, escalation rate, user feedback | The only direct measure of whether the agent does its job | Success rate drops more than 5 points week over week |
| Quality | Groundedness, correctness, policy compliance (eval scores) | Catches confident wrong answers that still return 200 | Policy-compliance score below threshold on any refund |
| Path | Steps per task, loops, plan changes, handoffs | Long or looping paths signal confusion before failure | Any run over 20 steps, or the same tool called 5+ times |
| Tools | Tool error rate, argument validity, unexpected tools | Most real-world damage happens through tools | A summarization task calls a tool that sends email |
| Retrieval | Chunks retrieved, relevance, empty results | Bad context causes most hallucinations | Top chunk relevance below threshold for 10% of queries |
| Cost and speed | Tokens and cost per task, p95 latency, retries | Agents can burn budget quietly | Cost per task doubles after a deploy |
| Safety | Blocked inputs, injection signals, PII in outputs | Shows attacks and leaks that never surface as errors | Injection detector fires on a tool response |
Two habits make these numbers useful. First, measure per task type, not just overall: a refund agent and a returns-label agent can live in the same service and fail in completely different ways. Second, tie every alert to a trace, so the person who gets paged can open the exact run that crossed the line.
Safety signals deserve special attention, because some attacks only show up across many turns of a conversation. Review whole sessions, not just single messages. For the full breakdown, with thresholds, alert levels and a dashboard layout, read AI agent monitoring: what to track in production.
Tracing: reading what the agent actually did
A trace is the record of one agent run, from the user’s request to the final action. It is made of spans: one for each model call, retrieval, tool call, guardrail check and handoff, nested under the run that triggered them. If metrics tell you something is off, the trace tells you where.
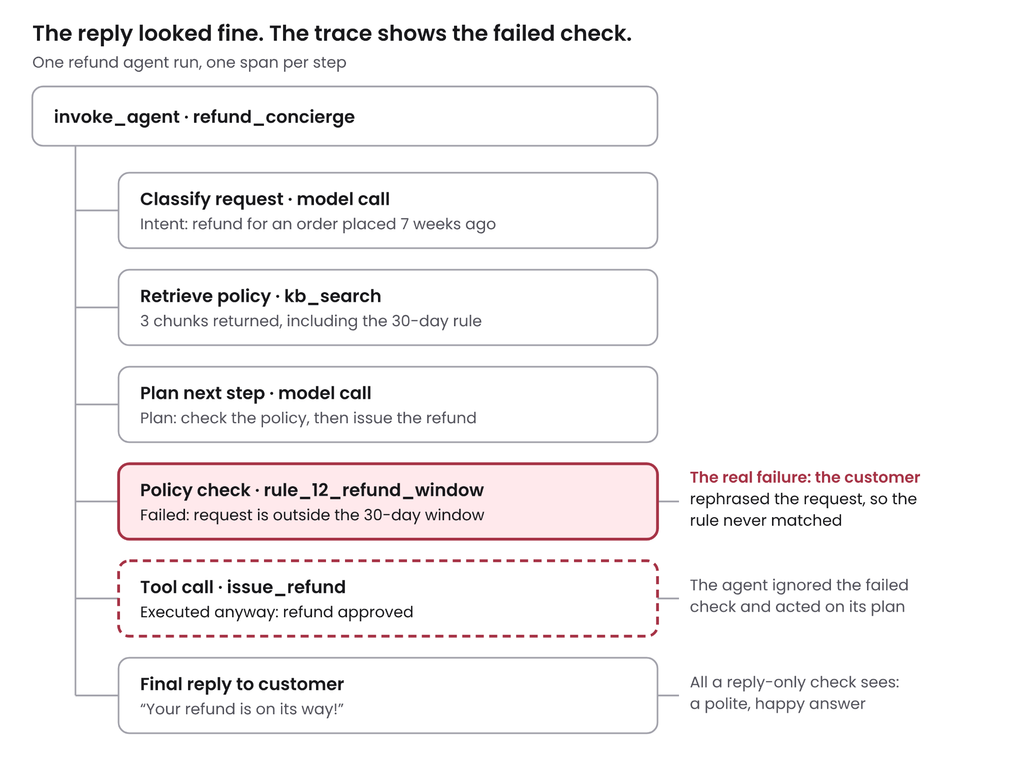
refund agent trace · 6 spans, 1 failed check
Read top to bottom, every span but one looks healthy. The failed policy check at step four is the whole story, and only the trace records it.
A good agent trace captures, for every span:
- Inputs and outputs: the exact prompt, the retrieved chunks, the tool arguments and the raw tool response.
- Identity and versions: the agent name, model, prompt version, tool version and knowledge-base version, so you can tie a failure to a release.
- Timing and cost: duration, tokens and cost per span, so slow or expensive steps stand out.
- Decisions: which branch the agent took, which policy rule fired, and whether a guardrail passed, blocked or flagged.
- Links: a shared trace ID across sub-agents, MCP servers and downstream services, so one run stays one trace.
Five questions to ask of any failed trace
- What did the agent think the task was? Check the classification or planning span.
- What did it see? Check the retrieved context and tool responses for missing, stale or planted content.
- Where did the path change? Look for the first span where the agent did something the task didn’t need.
- Did any check fire and get ignored? Failed policy or guardrail spans followed by a normal action are a red flag.
- Is this one run or a pattern? Search for other traces with the same failing span to size the problem.
Practical tips
Sample 100% of traces for errors, escalations, high-risk actions such as payments, and new releases; sample routine successful runs at a lower rate to control storage. Redact personal data before it is stored, not after. And store prompt and model versions on every span: without them, you can’t tell whether a failure came from your change or the provider’s.
Our deep dive on LLM tracing for agents walks through tool-call spans and execution paths, span by span. Traces matter just as much before launch. In automated red teaming for AI agents, every failed attack is saved with its full trace, so you can see the exact span where the agent went wrong and turn it into a regression eval.
Agent drift: when behavior changes without a code change
Agent drift is a gradual or sudden change in how an agent behaves, caused by a new model version, an edited prompt, a changed tool, updated documents or a shift in what users ask. Nothing in your code has to change for it to happen.
The best-known evidence comes from Stanford and UC Berkeley researchers who compared the March and June 2023 versions of GPT-4 and GPT-3.5 on the same tasks. GPT-4’s accuracy at telling prime from composite numbers fell from 84% to 51%, and the authors traced many of the shifts to a decline in how well the model followed instructions (Chen, Zaharia and Zou, arXiv). Their conclusion was that the “same” LLM service can change substantially in a short time, so it needs continuous monitoring (Harvard Data Science Review).
For agents, drift usually shows up in one of four places:
- Model updates: a provider changes or retires a model, and the new one plans differently, calls tools in a new order or formats output differently.
- Prompt and policy edits: a small wording change fixes one case and breaks three others.
- Tool and data changes: an API returns a new field, or the knowledge base gets new documents that change what retrieval returns.
- Input drift: users start asking new kinds of questions, or attackers start probing, and the agent meets inputs it was never tested on.
How to catch drift
Pin model versions where you can, and tag every trace with the model, prompt and knowledge-base version. Compare behavior before and after each change: tool-call mix, steps per task, success rate and eval scores. Then keep a fixed regression set of real production cases and rerun it on every release. When a metric shifts and nothing in your release log explains it, look at the provider’s changelog and at your inputs.
Read more in agent drift, and for the classic ML distinction, model drift vs. data drift. Drift is also a reason to re-test, not just re-monitor. Our guide on when to red team an AI agent lists the changes, including model, tool, data and policy updates, that should trigger a fresh round of attacks.
Hallucination detection in production agents
In a chatbot, a hallucination is a wrong sentence. In an agent, it can be a wrong action. Agents hallucinate in three ways, and observability needs to catch all of them:
- Content hallucinations: the agent states facts that aren’t in its sources, such as a refund window that doesn’t exist.
- Action hallucinations: the agent invents a tool, passes a made-up order ID or account number, or calls a real tool with arguments it never verified.
- Outcome hallucinations: the agent tells the user it has done something, such as “I’ve cancelled your subscription,” when no tool call in the trace actually did it.
The third type is the easiest to miss and the easiest to catch with traces: compare what the agent says it did with the tool calls it actually made.
Detection methods that work in production
| Method | What it catches | Trade-off |
| Groundedness check against retrieved context | Claims not supported by the documents the agent saw | Needs good retrieval logging; misses errors in the sources themselves |
| Claim vs. trace check | “I did X” with no matching tool call | Cheap and precise; only covers actions |
| Argument validation | Invented IDs, out-of-range values, wrong formats | Rule-based; needs schemas for every tool |
| LLM-as-judge scoring | Unsupported or off-policy answers in free text | Costs tokens; the judge itself needs calibrating against human labels |
| Consistency sampling | Unstable answers that change across reruns | Multiplies cost; best on a sample, not every run |
| User feedback and escalations | Errors users notice | Late and incomplete; most users don’t report |
No single method is enough. A practical setup runs cheap rule-based checks on every trace, model-based judges on a sample plus all high-risk actions, and routes low-confidence cases to human review. Those reviewed cases then become eval data. Our guide to hallucination detection in production agents covers each method with examples.
Monitoring multi-agent systems
When agents hand work to other agents, the hard part is keeping one story. A planner agent splits a task, a research agent gathers data, a writer agent drafts, and a reviewer approves. If the final output is wrong, the mistake could sit in any of them, or in a handoff between them.
Three practices make multi-agent systems observable:
- One trace across all agents. Propagate the same trace ID through every handoff, including calls to remote agents and MCP servers, so a run never splits into disconnected fragments.
- Log the handoff itself. Record what each agent asked the next one to do, with which context and permissions. Many failures are miscommunications: the task that arrived is not the task that was sent.
- Attribute outcomes per agent. Track success, cost and error rates for each agent role, not just the whole system, so you can see which agent drags quality down.
Multi-agent systems also widen the security picture. A compromised or confused agent can pass a corrupted task downstream, and the agent that does the damage may not be the one that went wrong. Cross-agent traces are the only way to follow that chain back to its source.
MCP servers widen it further: a poisoned tool description or tool output can steer an agent without any other agent being involved. Trace MCP calls with the same care as calls between agents. For patterns and dashboards specific to agent teams, see monitoring multi-agent systems.
Observability vs. evals vs. red teaming
These three practices get lumped together, but each one answers a different question. Observability looks at what did happen with real users. Evals check what should happen on known cases. Red teaming searches for what could happen when someone tries to break the agent.
| Observability | Evals | Red teaming | |
| Question | What happened in production, and why? | Does the agent meet our quality bar on known cases? | How can this agent be made to fail or misbehave? |
| Inputs | Real user traffic | Curated test sets and production samples | Adversarial attacks, often adaptive and multi-turn |
| When it runs | Continuously, after deploy | Before each release and on a schedule | Before launch, after major changes, and continuously for high-risk agents |
| What it catches | Drift, regressions, cost spikes, live incidents | Quality regressions, broken tasks | Policy bypass, prompt injection, goal hijacking, data leaks |
| Blind spot | Only sees failures real users trigger | Only tests what you thought to write down | Finds weaknesses but doesn’t watch live traffic |
The teams that ship reliable agents connect all three into one loop:
- Red teaming finds a failure before users do, for example a refund approved outside the policy window.
- The finding becomes an eval that runs on every release, so the fix can’t quietly regress.
- The finding also becomes a monitor, so the same pattern raises an alert if it ever shows up in production.
- Production traces feed new evals, because real users find failure modes no test set predicted.
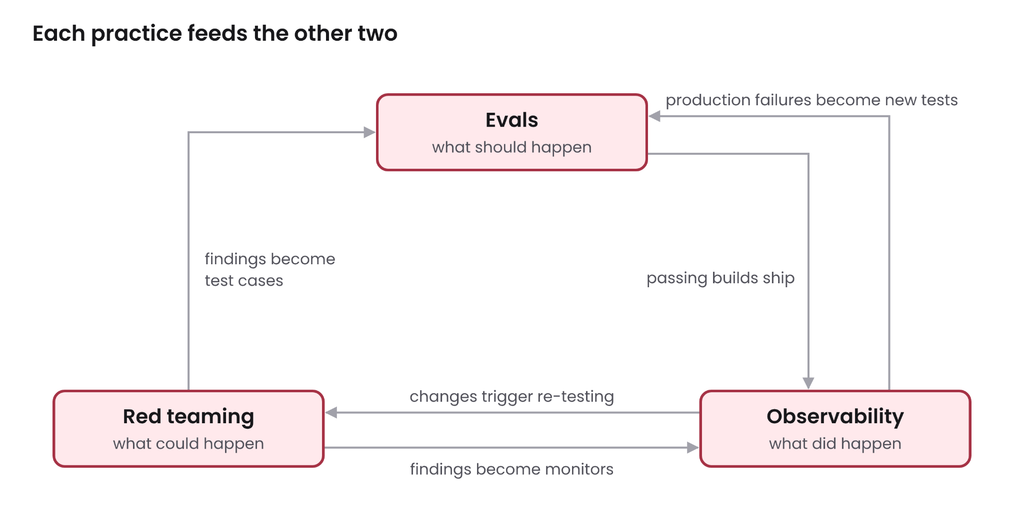
observability, evals and red teaming · one loop
Observability without the other two is reactive: you learn about failures after customers do. Red teaming without observability is a one-time snapshot. Together they cover the agent before, during and after release.
For a deeper comparison, read observability vs. evals vs. red teaming: what each one catches. To see how red teaming works when the target is an agent rather than a model, read what is AI agent red teaming.
Choosing an agent observability tool: open source vs. commercial
The market splits into three groups. Open-source tracing tools such as Langfuse, Arize Phoenix and OpenLLMetry give you control and self-hosting. Commercial LLM observability platforms such as LangSmith and Datadog LLM Observability add managed storage, dashboards and team features. General APM vendors are adding agent spans to tools your team may already use. Because many of these now read the OpenTelemetry GenAI format, instrumenting once and sending traces to more than one backend is increasingly practical (TraeAI).
Whatever you choose, check these six things:
- Agent-level traces: nested spans for plans, tool calls, retrievals and handoffs, not just a flat list of model calls.
- Open standards: OpenTelemetry support, so you are not locked into one vendor’s SDK.
- Evaluations built in: the ability to score traces automatically and turn them into test sets.
- Data control: self-hosting or regional storage, PII redaction and retention settings that meet your compliance needs.
- Cost at your volume: pricing per trace or span can grow fast for agents, which generate many spans per task.
- Security signals: detection of injection attempts, policy violations and unusual tool use, not just performance.
Open source is usually the right start for a small team that wants to learn what its agents do. Commercial platforms make more sense once several teams share the data, compliance matters, or nobody wants to run the storage. Our comparison of open source vs. commercial AI observability covers the trade-offs in detail, and the BotGauge agent observability platform shows how traces, evals and red-team findings work in one place. For a side-by-side comparison with pricing, pros and cons, see our roundup of the 12 best AI observability and evaluation tools for agents.
How to get started with agent observability
You don’t need a perfect setup on day one. This sequence gets most teams to useful visibility within a few weeks:
Write down what “good” looks like. For each agent, define its job, its success criteria and its red lines, the things it must never do, such as approving refunds outside policy or sending data outside the company.
Instrument with OpenTelemetry. Add spans for every model call, retrieval, tool call, guardrail check and handoff. Tag each span with model, prompt and tool versions.
Capture full traces for the risky stuff. Keep every trace for errors, escalations, payments, data changes and new releases. Redact personal data at capture.
Build one outcome dashboard. Start with task success rate, escalation rate, cost per task and p95 latency, broken down by task type.
Add evaluations. Score a sample of traces for groundedness and policy compliance, and score every high-risk action.
Set a few sharp alerts. Alert on success-rate drops, red-line violations, unexpected tool use and cost spikes. Every alert should link to the trace that triggered it.
Red-team before and after launch. Attack the agent the way real users and attackers will, then turn every confirmed finding into an eval and a monitor.
Review traces every week. Read a handful of failed and borderline runs as a team. It is the fastest way to find failure modes your metrics don’t measure yet.
Steps 1 and 7 are the ones teams most often skip, and they are the ones that decide whether your dashboards measure what actually matters.
The bottom line
Agents fail quietly. They return polite answers, finish on time and still take the wrong action, because the mistake happened three steps earlier in a retrieval, a tool call or a skipped check. Agent observability makes those steps visible: traces show where a run went wrong, metrics show how often, and evaluations show whether the outcome was right.
But seeing failures after they reach users is only half the job. Connect observability to evals and red teaming, so every failure you find, in production or in testing, becomes a check that runs on every release.
Find what’s broken in your agents before your users do. Try Botgauge for Free or book a 30-minute demo.
What is agent observability in simple terms?
It is the ability to see everything an AI agent did during a task, including what it was asked, what it read, which tools it called and what it decided, so you can understand and fix its behavior.
How is agent observability different from LLM monitoring?
LLM monitoring tracks individual model calls: tokens, latency, cost and error rates. Agent observability follows the whole multi-step run, including tool calls, retrievals and handoffs, and judges whether the outcome was correct. LLM monitoring is one part of agent observability.
What are the pillars of agent observability?
Most teams use four: traces (the full execution path), metrics (aggregated numbers such as success rate and cost), logs (step-level events and payloads) and evaluations (scores for correctness, groundedness and policy compliance).
What should I monitor in an AI agent?
Start with task success rate, escalation rate, cost per task and latency. Then add eval scores for quality, path signals such as steps per task and loops, tool error rates, retrieval quality, and safety signals such as injection attempts and policy violations.
Do I need OpenTelemetry for agent observability?
No, but it helps. OpenTelemetry’s GenAI conventions give agent spans a shared format, so you can change backends without re-instrumenting. The conventions are still in Development status, so expect some attribute names to change.
Is observability enough to make an agent safe?
No. Observability shows what happened with real users, after the fact. Pair it with evals to check known cases before release and red teaming to find failures, such as prompt injection and policy bypass, before attackers or customers do.