TL;DR
AI agent monitoring is the continuous tracking of how an AI agent performs in production: whether it completes tasks, how good its outputs are, which tools it calls, what it costs and whether it breaks any rules. Unlike server monitoring, it has to catch failures that look like success, such as a fast, polite reply that took the wrong action. Track six layers (outcome, quality, behavior, tools, cost and safety), alert on changes from your baseline, and link every alert to the trace behind it.
What is AI agent monitoring?
An AI agent takes a goal, plans the steps, calls tools and acts on its own. Monitoring answers one question about that work, continuously: is the agent still doing its job well?
Traditional monitoring asks whether a service is up and fast. That is still necessary for agents, but it misses most of what goes wrong. An agent can return HTTP 200 in under two seconds and still refund the wrong order, quote a policy that doesn’t exist, or loop through the same tool ten times before giving up. None of that shows up as an error.
So agent monitoring adds three things on top of normal service health:
• Outcome tracking: did the task actually get done, judged at the level of the user’s goal rather than the HTTP response?
• Quality and policy checks: was the answer correct, grounded in the right sources and within the rules the agent must follow?
• Behavior signals: did the agent take a sensible path, with the tools and steps you’d expect for this kind of task?
Monitoring vs. observability
The two terms are often used interchangeably, but they do different jobs. Monitoring watches known signals and tells you when something crosses a line: success rate dropped, cost doubled, a red-line rule fired. Observability is the ability to dig into any single run afterwards and understand why it happened, mostly through traces.
You need both, and they share the same data. For the observability side in depth, see our complete guide to AI agent observability. Monitoring tells you there is a problem and how big it is. Observability tells you what caused it. A good rule: every monitoring alert should link straight to an example trace, so the person who gets paged can see the failing run in one click.
The AI agent metrics to track
Group your metrics into six layers, from the outcome the business cares about down to the signals that explain it. Start at the top: if you can only track three numbers, make them task success rate, escalation rate and cost per task.
| Layer | Metric | How to measure it | Example alert |
| Outcome | Task success rate | Tasks completed correctly ÷ all tasks, judged by an eval or a confirmed end state (refund issued, ticket closed) | Drops 5+ points below the 7-day average |
| Outcome | Escalation rate | Tasks handed to a human ÷ all tasks | Rises 50% above baseline in an hour |
| Outcome | User feedback | Thumbs-down, repeat contacts or reopened tickets per 100 tasks | Repeat contacts climb two days in a row |
| Quality | Groundedness score | Share of claims supported by the retrieved sources, scored by a judge model on a sample | Falls below your agreed floor |
| Quality | Policy compliance | Share of actions that pass the agent’s business rules (refund limits, approval steps) | Any red-line violation |
| Behavior | Steps per task | Median and p95 number of model and tool calls per run | p95 doubles after a release |
| Behavior | Loop rate | Runs where the same tool is called with the same arguments 3+ times | Above 1% of runs |
| Behavior | Plan deviation | Runs that use tools outside the expected set for that task type | A summary task calls a tool that sends email |
| Tools | Tool error rate | Failed calls ÷ all calls, per tool | 2x baseline over 10 minutes |
| Tools | Invalid arguments | Calls rejected for bad IDs, formats or values | Any spike on a write tool |
| Retrieval | Empty or low-relevance retrievals | Queries where no chunk passes the relevance threshold | More than 10% of queries |
| Cost and speed | Cost per task | Total token and tool spend across the whole run ÷ tasks | Doubles against the 7-day average |
| Cost and speed | p95 latency per task | End-to-end time from request to final action | Breaches your SLA for 15 minutes |
| Safety | Injection and jailbreak signals | Detector hits on user input, documents and tool output | Any hit on a tool response |
| Safety | New external destinations | Domains, emails or accounts the agent contacts for the first time | Any destination not on the allow-list |
| Safety | Sensitive data in outputs | PII or secrets detected in replies or tool arguments | Any match |
Three notes on reading this table.
Measure at the task level, not the call level. One agent task can involve a dozen model and tool calls. Cost, latency and success only mean something when you add them up across the whole run, which is why session-level tracing matters (Latitude).
Split everything by task type. A refund request and an order-status question can share one agent and fail in completely different ways. An overall success rate of 94% can hide a refund success rate of 70%.
Treat safety signals as first-class metrics. A new destination appearing in tool calls is a classic sign of prompt injection, because an attacker’s instruction usually ends with sending data somewhere (Toolradar). Some attacks only appear across many turns, so review whole sessions, not just single messages.
Setting thresholds and alerts that don’t cry wolf
Agent metrics are noisy. Traffic mix changes by the hour, judge models disagree with themselves at the margins, and a single odd user can skew a small sample. Alerts built on fixed numbers either fire constantly or never. These rules keep them useful.
Alert on change from baseline, not on absolute values. “Tool errors at 2x the 7-day average for 10 minutes” survives a busy Monday. “Tool errors above 3%” does not.
Use three severity levels.
| Severity | What triggers it | Who responds | Example |
| Page now | A red line was crossed, or real damage is likely | On-call engineer, immediately | Refund issued above the agent’s limit; data sent to an unknown domain |
| Investigate today | A key metric moved well outside its normal range | Agent owner, same day | Task success down 5 points; cost per task doubled |
| Review weekly | A slow trend or a new pattern | Team, in the weekly review | Steps per task creeping up; a new type of user request |
Red lines are binary. For the few things the agent must never do, such as approving out-of-policy refunds, changing permissions or sending data outside the company, alert on a single occurrence. Don’t average them.
Wait for enough data. Set a minimum sample size before a rate-based alert can fire, so ten tasks at 3am don’t page anyone.
Link every alert to a trace. An alert that says “success rate dropped” starts an investigation. An alert that says “success rate dropped; here are five failing runs” usually ends one.
Re-baseline after every intended change. A new model, prompt or tool changes what normal looks like. Mark releases on your charts and reset baselines deliberately, or your alerts will either flood or go quiet.
Building an agent monitoring dashboard
A good agent dashboard answers four questions in order, top to bottom. The person looking at it should know within ten seconds whether the agent is healthy, and within a minute where to look if it isn’t.
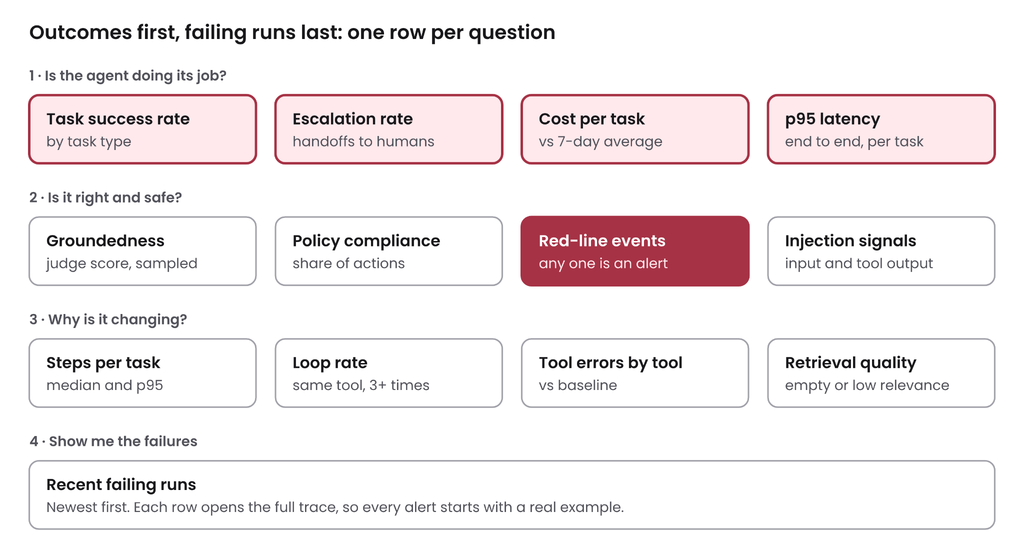
agent monitoring dashboard · 4 rows, top to bottom
Row 1 is the headline: task success, escalations, cost and latency, each split by task type. Row 2 holds quality and safety, with red-line events shown as a count, because any single one needs attention. Row 3 holds the signals that explain changes in the rows above. Row 4 lists recent failing runs with a link to each trace, so nobody has to search logs to find an example.
Two layout tips. Mark every release on every time-series chart, so a step change lines up with the deploy that caused it. And keep one dashboard per agent rather than one for all agents; averages across different agents hide the one that’s struggling.
What to monitor by agent type
The six layers apply to every agent, but the metric that matters most depends on what the agent does. Use this table to choose your top three.
| Agent type | Watch most closely | Typical silent failure | Red line to alert on |
| Customer support | Resolution rate, escalation rate, repeat contacts | Polite answers that don’t solve the problem, so customers come back | Promises the business can’t keep, such as unauthorized credits |
| RAG / knowledge assistant | Groundedness, empty retrievals, citation accuracy | Confident answers built on stale or missing documents | Answers that cite a source that doesn’t contain the claim |
| Transactional (refunds, payments, bookings) | Policy compliance, action accuracy, amount distribution | Actions that pass every technical check but break a business rule | Any action above its limit or outside its policy window |
| Coding agent | Test pass rate, revert rate, commands run | Changes that pass review but break something downstream | Disabling checks, changing its own permissions, running unapproved commands |
| Multi-agent system | Handoff success, per-agent error rate, end-to-end cost | A task that arrives at the next agent different from how it was sent | An agent requesting actions outside its role |
Transactional agents deserve the strictest setup, because their mistakes move money. For them, check the distribution of amounts, not just the count of actions. A refund agent whose average refund creeps up by 30% over a month is telling you something, even if no single refund broke a rule. Multi-agent systems need their own setup, covered in monitoring multi-agent systems.
Common agent monitoring mistakes
• Monitoring the model, not the agent. Token counts and per-call latency look healthy while whole tasks fail. Aggregate to the task. Model-level metrics still matter underneath; LLM monitoring covers them.
• Treating HTTP 200 as success. The response code says the request finished, not that the agent did the right thing. Success needs an outcome check.
• Averaging everything together. One overall success rate hides the task type that is failing. Break it down.
• No red lines. Without a written list of things the agent must never do, there is nothing to alert on when it does them.
• Alerts without traces. An alert that can’t show a failing run turns every page into a manual search through logs.
• Never re-baselining. After a model or prompt change, old thresholds are wrong. Expect either alert floods or silence.
• Only watching real traffic. Production monitoring only sees failures that real users happen to trigger. Attacks and rare edge cases may not show up until they cause damage, which is why teams pair monitoring with automated red teaming before and after release.
How to set up AI agent monitoring
1. Write down the job and the red lines. For each agent, define what a successful task looks like and the few things it must never do.
2. Instrument every step. Add OpenTelemetry spans for model calls, retrievals, tool calls, guardrail checks and handoffs, tagged with model, prompt and tool versions.
3. Define the end state for each task type. Decide how you’ll know a task succeeded: a tool call that completed, a ticket that stayed closed, or an eval score above a threshold.
4. Pick three headline metrics. Usually task success rate, escalation rate and cost per task, split by task type.
5. Add quality and safety checks. Score a sample of runs for groundedness and policy compliance, score every high-risk action, and run injection detection on inputs and tool outputs.
6. Build the dashboard and alerts. Use the four-row layout above, baseline-relative thresholds and three severity levels, each linked to traces.
7. Re-test when the agent changes. A new model, tool, data source or policy is a reason to rerun your tests, not just to watch the dashboard. See when to red team an AI agent for the triggers.
8. Review failing runs weekly. Read a handful of failed and borderline traces as a team, and turn each new failure mode into an eval and, if needed, a new alert.
The bottom line
Agents rarely fail loudly. They fail with a fast, friendly reply that did the wrong thing, a tool loop that quietly burns budget, or a policy rule that stops matching after a prompt change. Server metrics won’t catch any of it.
Monitor the agent at the level of the task: did it succeed, was it right, did it follow the rules, and what did it cost. Alert on changes, link every alert to a trace, and keep testing the agent the way attackers will, because monitoring only sees the failures real users have already found.
Find what’s broken in your agents before your users do. BotGauge red-teams, traces and monitors AI agents in one place.Try Botgauge for Free or book a 30-minute demo.
What is AI agent monitoring?
It is the continuous tracking of an AI agent’s performance in production, including task success, output quality, tool use, cost and safety, so teams catch failures and regressions before users report them.
How do you monitor AI agents in production?
Instrument every model call, retrieval and tool call with traces. Then track task-level metrics such as success rate, escalation rate and cost per task, add quality and safety checks, and alert on changes from baseline, with each alert linked to an example trace.
What metrics should you track for AI agents?
Start with task success rate, escalation rate and cost per task. Add groundedness and policy-compliance scores, steps per task and loop rate, tool error rate, latency, and safety signals such as injection attempts and new external destinations.
What is the difference between agent monitoring and agent observability?
Monitoring watches known signals and alerts when they cross a line. Observability lets you investigate any single run in depth to find out why it happened. Monitoring tells you there is a problem; observability tells you its cause.
What should an agent monitoring dashboard show?
Four rows: outcomes at the top (success, escalations, cost), quality and safety next, then behavior and tools, and finally a list of recent failing runs linked to their traces.
Which tools can I use for AI agent monitoring?
Options range from open-source tracing tools to commercial LLM observability platforms and APM vendors with agent features. Our comparison of the 12 best AI observability and evaluation tools for agents covers pricing, strengths and gaps.